3D Digitisation methods
Last updated on 2024-12-31 | Edit this page
Context
3D digitisation has a rich history dating back to the 1960s, originating from the pioneering work at MIT in computer-aided design. However, over the past few decades, it has progressively evolved into a widespread practice, driven by improved accessibility and affordability of hardware and software systems used for acquiring, processing, and visualising 3D data.
Like with many technologies, the heritage domain has served as a valuable testing ground for exploring different equipment, workflows, and methods to visualise and interact with digital heritage assets.
The primary advantage of 3D digitised assets lies in the inherent nature of their multidimensional data, which can be easily manipulated for detailed study or to highlight specific attributes, exchanged via the web, and experienced by the public through a diverse range of online and offline applications.
Over the past few years, major institutions like the Smithsonian, the British Museum, the Science Museum have promoted 3D digitisation initiatives for their collections and have also made collections of 3D objects accessible online.
Given the gradual democratisation of 3D technologies, it can be argued that 3D digitisation has become crucial for various aspects of cultural heritage management.
It enables conservation and restoration efforts, facilitates the study and exchange of knowledge among researchers and communities, reconstructs damaged or lost assets and sites, and provides access to remote or inaccessible objects and locations.
Additionally, it allows individuals, including those with impairments, to experience artefacts, monuments, and sites.
To choose the right method to digitise in 3D a collection of artefacts, a monument or site, several decisions need to be taken concerning the:
- Aim of the project
- Scope of the project (e.g., collection to digitise and type/size/condition/location of assets)
- Audience of the project
- Cost of digitisation
- Resources (hardware, software, staff time)
- Knowledge and skills
- Purpose of digitisation
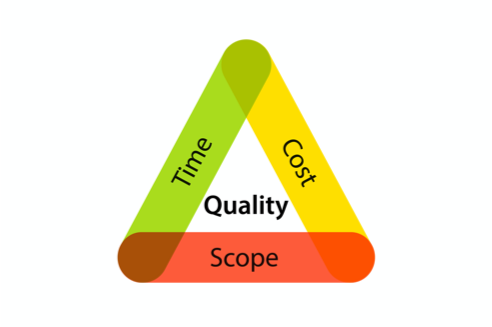
All these, as well as issues around data sovereignty, Intellectual Property Rights (IPR) and ethics will define the quality, reach and potential impact of the project.
Planning for 3D digitisation
When setting up a digitisation project, it is imperative to have a careful plan in mind about the purpose, the resources and the processes of the project.
A data management plan is also necessary to as part of such preparation. The National Heritage Lottery Fund (2023) has recently produced a Digitisation Project Planner to help with such preparation.
Currently, there are no internationally recognised standards for planning, organising, setting up, and implementing a 3D data acquisition project. Furthermore, there is no widely accepted standard for specifying the level of detail and accuracy required for 3D digitisation.
Additionally, there are no standard guidelines regarding the quantity and quality of data for acquisition and delivery. Consequently, there is a clear need for standardisation to ensure the sustainability and long-term preservation of 3D data, including facilitating access, and interaction with data.
Challenge: Digitisation Planner
Access and download the Digitisation Planner from the National Heritage Lottery Fund website.
Go through the sections of the planner (sheet 1 and 2) and try to respond to the proposed questions.
Are there any sections or questions where you need to put more effort into responding to within the context of your project?
Try to articulate and write down some responses to these questions.
Methods
There are many methods to capture or construct 3D data and there is always research and efforts to combine methods and experiment with new acquisition types and combinations of data. Here we present the most widespread methods in the field of 3D digitisation.
Photogrammetry
Photogrammetry is the ‘art, science, and technology of obtaining reliable information about physical objects and the environment through processes of recording, measuring and interpreting photographic images’ (American Society for Photogrammetry and Remote Sensing).
Photogrammetry is one of the most popular methods to acquire information about the shape and appearance of cultural heritage assets, as it is cost-effective and essentially involves capturing 2D images with a camera and then using appropriate software to construct a 3D model.
This happens sequentially as the photogrammetric software will first detect features on the images, then proceed with feature matching and lastly, it will reconstruct the 3D asset with or without colour.
DSLR cameras, digital compact cameras and even mobile phones can be used for photogrammetry, but the result of such acquisition will largely depend on the conditions and quality of the acquired images.
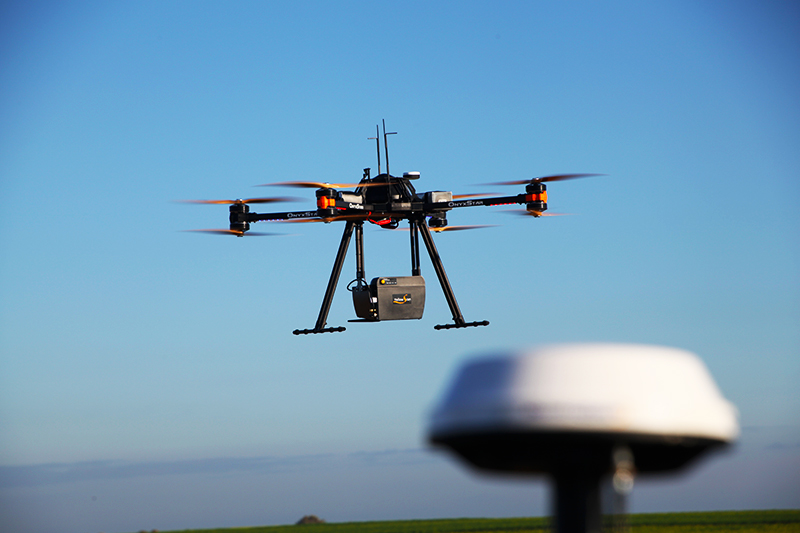
Photogrammetry can be used for different heritage objects, ranging from small movable artefacts to large immovable assets or sites. Aerial photogrammetry is used to acquire images from the air using an aircraft or drone (UAV - Unmanned Aerial Vehicle) and combining them with georeferencing data. Terrestrial photogrammetry is used to acquire images from the ground or near the ground with cameras. Close-range photogrammetry is a branch of terrestrial photogrammetry and refers to the acquisition of photographs from a shorter distance with regards to the object that we want to capture.
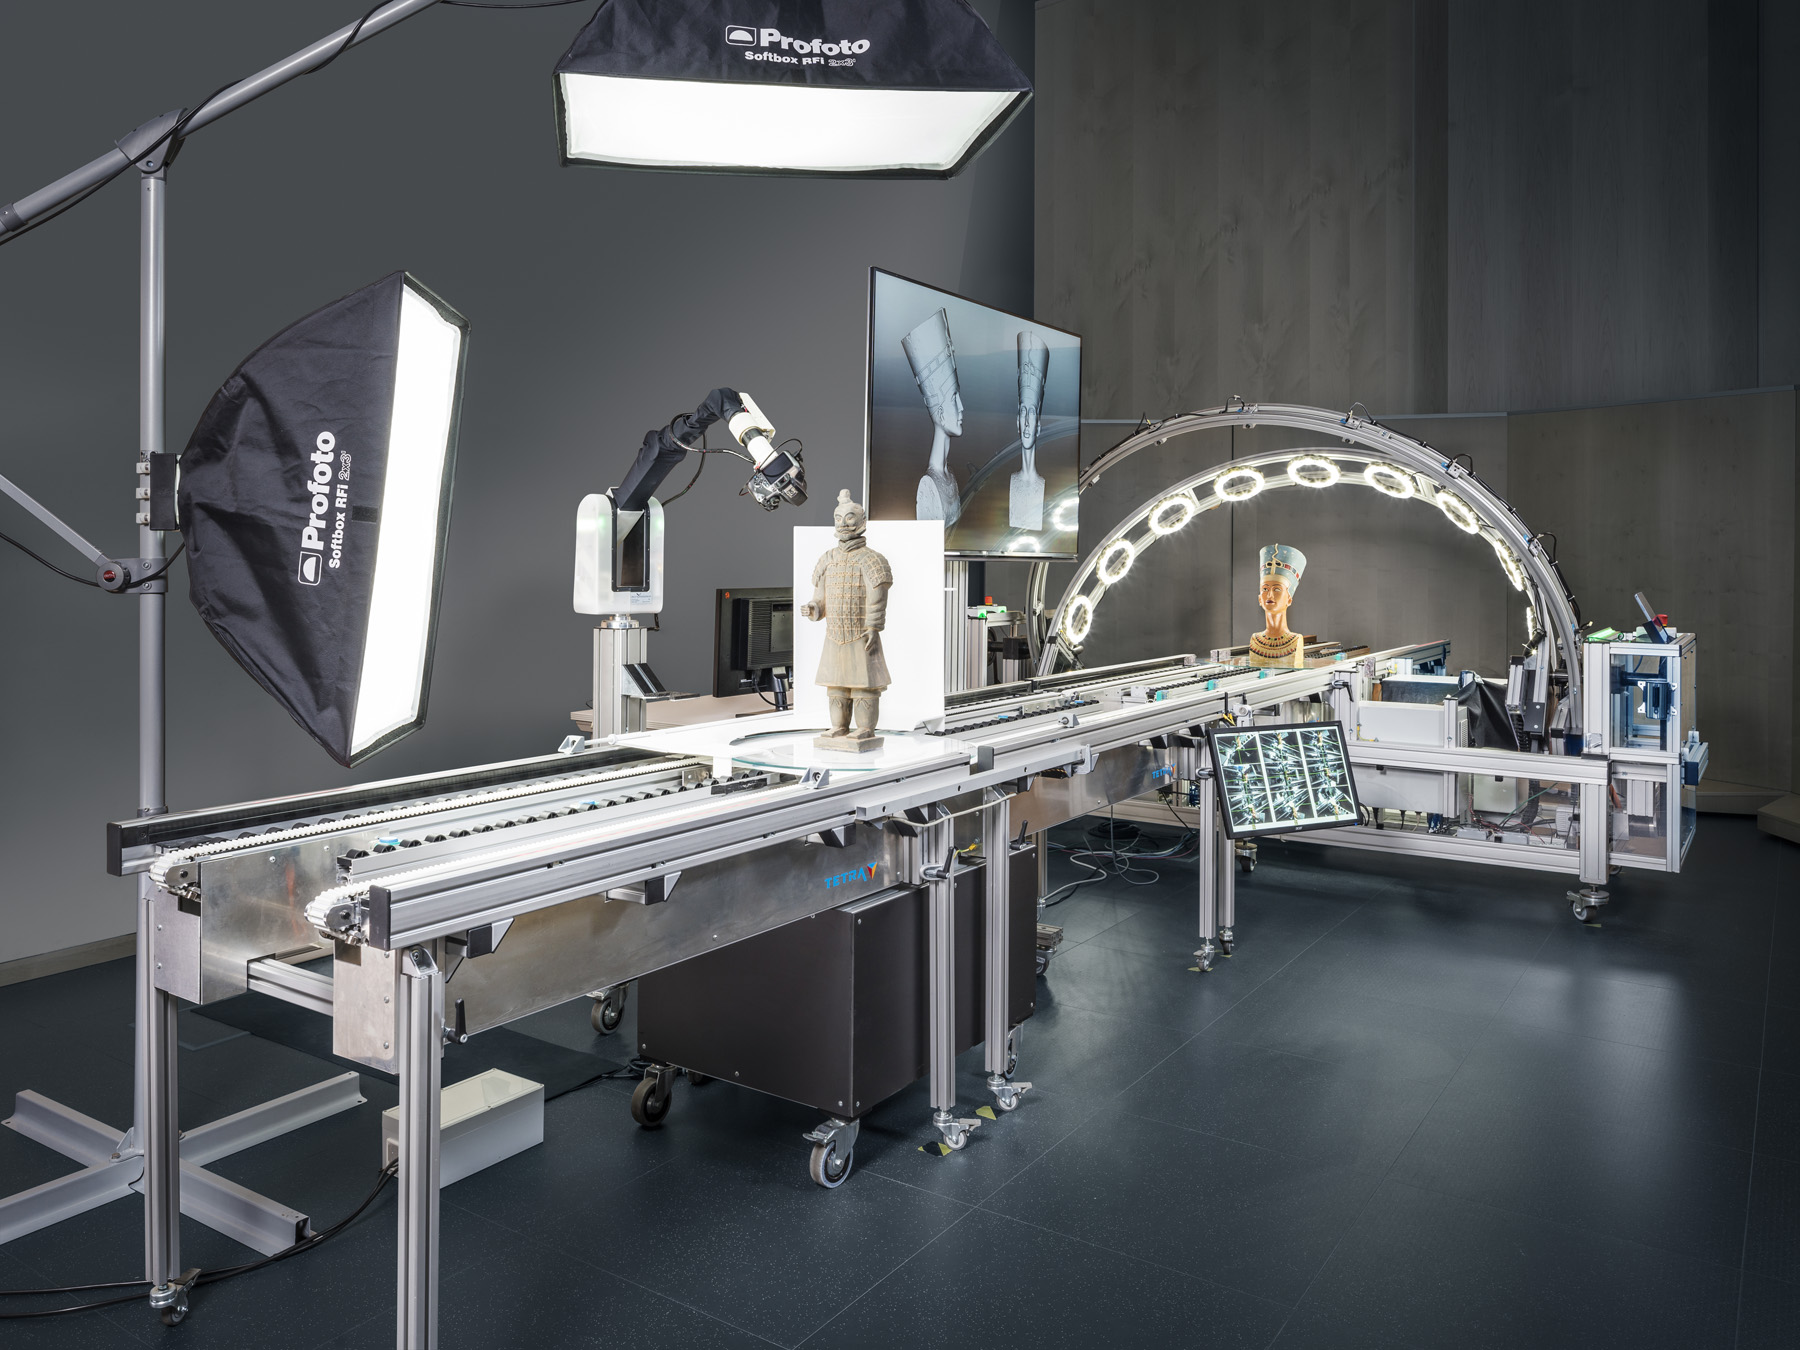
Laser scanning
Laser scanning refers to all the techniques which deploy a laser to calculate shape, i.e., the distance between an object and the point from where the laser is emitted. Laser scanning can also acquire colour information if it is equipped with sensors to get such data. When deploying laser scanning, a set of points or point-cloud is acquired. Each point will have x, y, z coordinates.
The main types of laser scanning are:
Time of flight (TOF)
This is used for terrestrial laser scanning capturing archaeological or excavation sites, as well as larger architectural monuments. These scanners essentially measure the time it takes for a laser pulse emitted from the scanner to reach a given surface and then return. The accuracy of these scanners depends on the accuracy of their timer when calculating the returning signal.
TOF systems can also acquire colour through internal or external cameras attached to the scanner. Usually, TOF systems are deployed for acquisition up to 300 meters away but might have lower acquisition rates and accuracy.
Structured light scanners
These are scanners which emit patterns of light, such as stripes, parallel lines and QR-code-like light onto the surface of an object. Such scanners measure the distance from the scanner to the surface of the scanned object by monitoring the distortions of the projected pattern using triangulation.
Structured light scanners, depending on the type of light pattern they emit, can be divided into phase shift, random speckle and multi-line scanners. The most popular structured light scanners are the phase shift scanners, and these are used to acquire objects at approximately 80 meters away (or more depending on the scanner).
Random speckle and multi-line scanners are mostly used to acquire assets with handheld scanners at short distances. Structured light scanners are faster than TOF scanners.

Triangulation
These scanners work for a shorter-range acquisition, usually up to 2 meters away, and are equipped with a laser source and a camera. Such scanners use a spot, line or pattern laser beam which is emitted onto an object and the deformation of such line or pattern is measured by a camera using the triangulation principle to calculate depth. Triangulation scanners can be very ‘accurate’ and can also capture colour depending on the options offered by each model.
Airborne laser scanning or LiDAR (light detection and ranging)
These are scanners used on aircrafts to acquire 3D information about the earth’s surface and ‘reveal’ features in the landscape, such as surface structures, which can be visible as marks on the ground. LiDAR scanners emit pulses which are reflected when they reach the ground.
The time needed for the laser light to return to the aircraft along with the information from GPS enables to construct detailed and ‘accurate’ maps of the surface of the ground. The advantage of the LiDAR systems is that they can filter signals and choose the ones which will reach the ground instead of the ones which are reflected by woodland and plants.
In such a way, ‘hidden’ constructions can become visible in places where access and surveys are difficult to happen. Historic England has several examples of the deployment of such scanning technology on their website along with examples of LiDAR mapping.
Computed Tomography (CT)
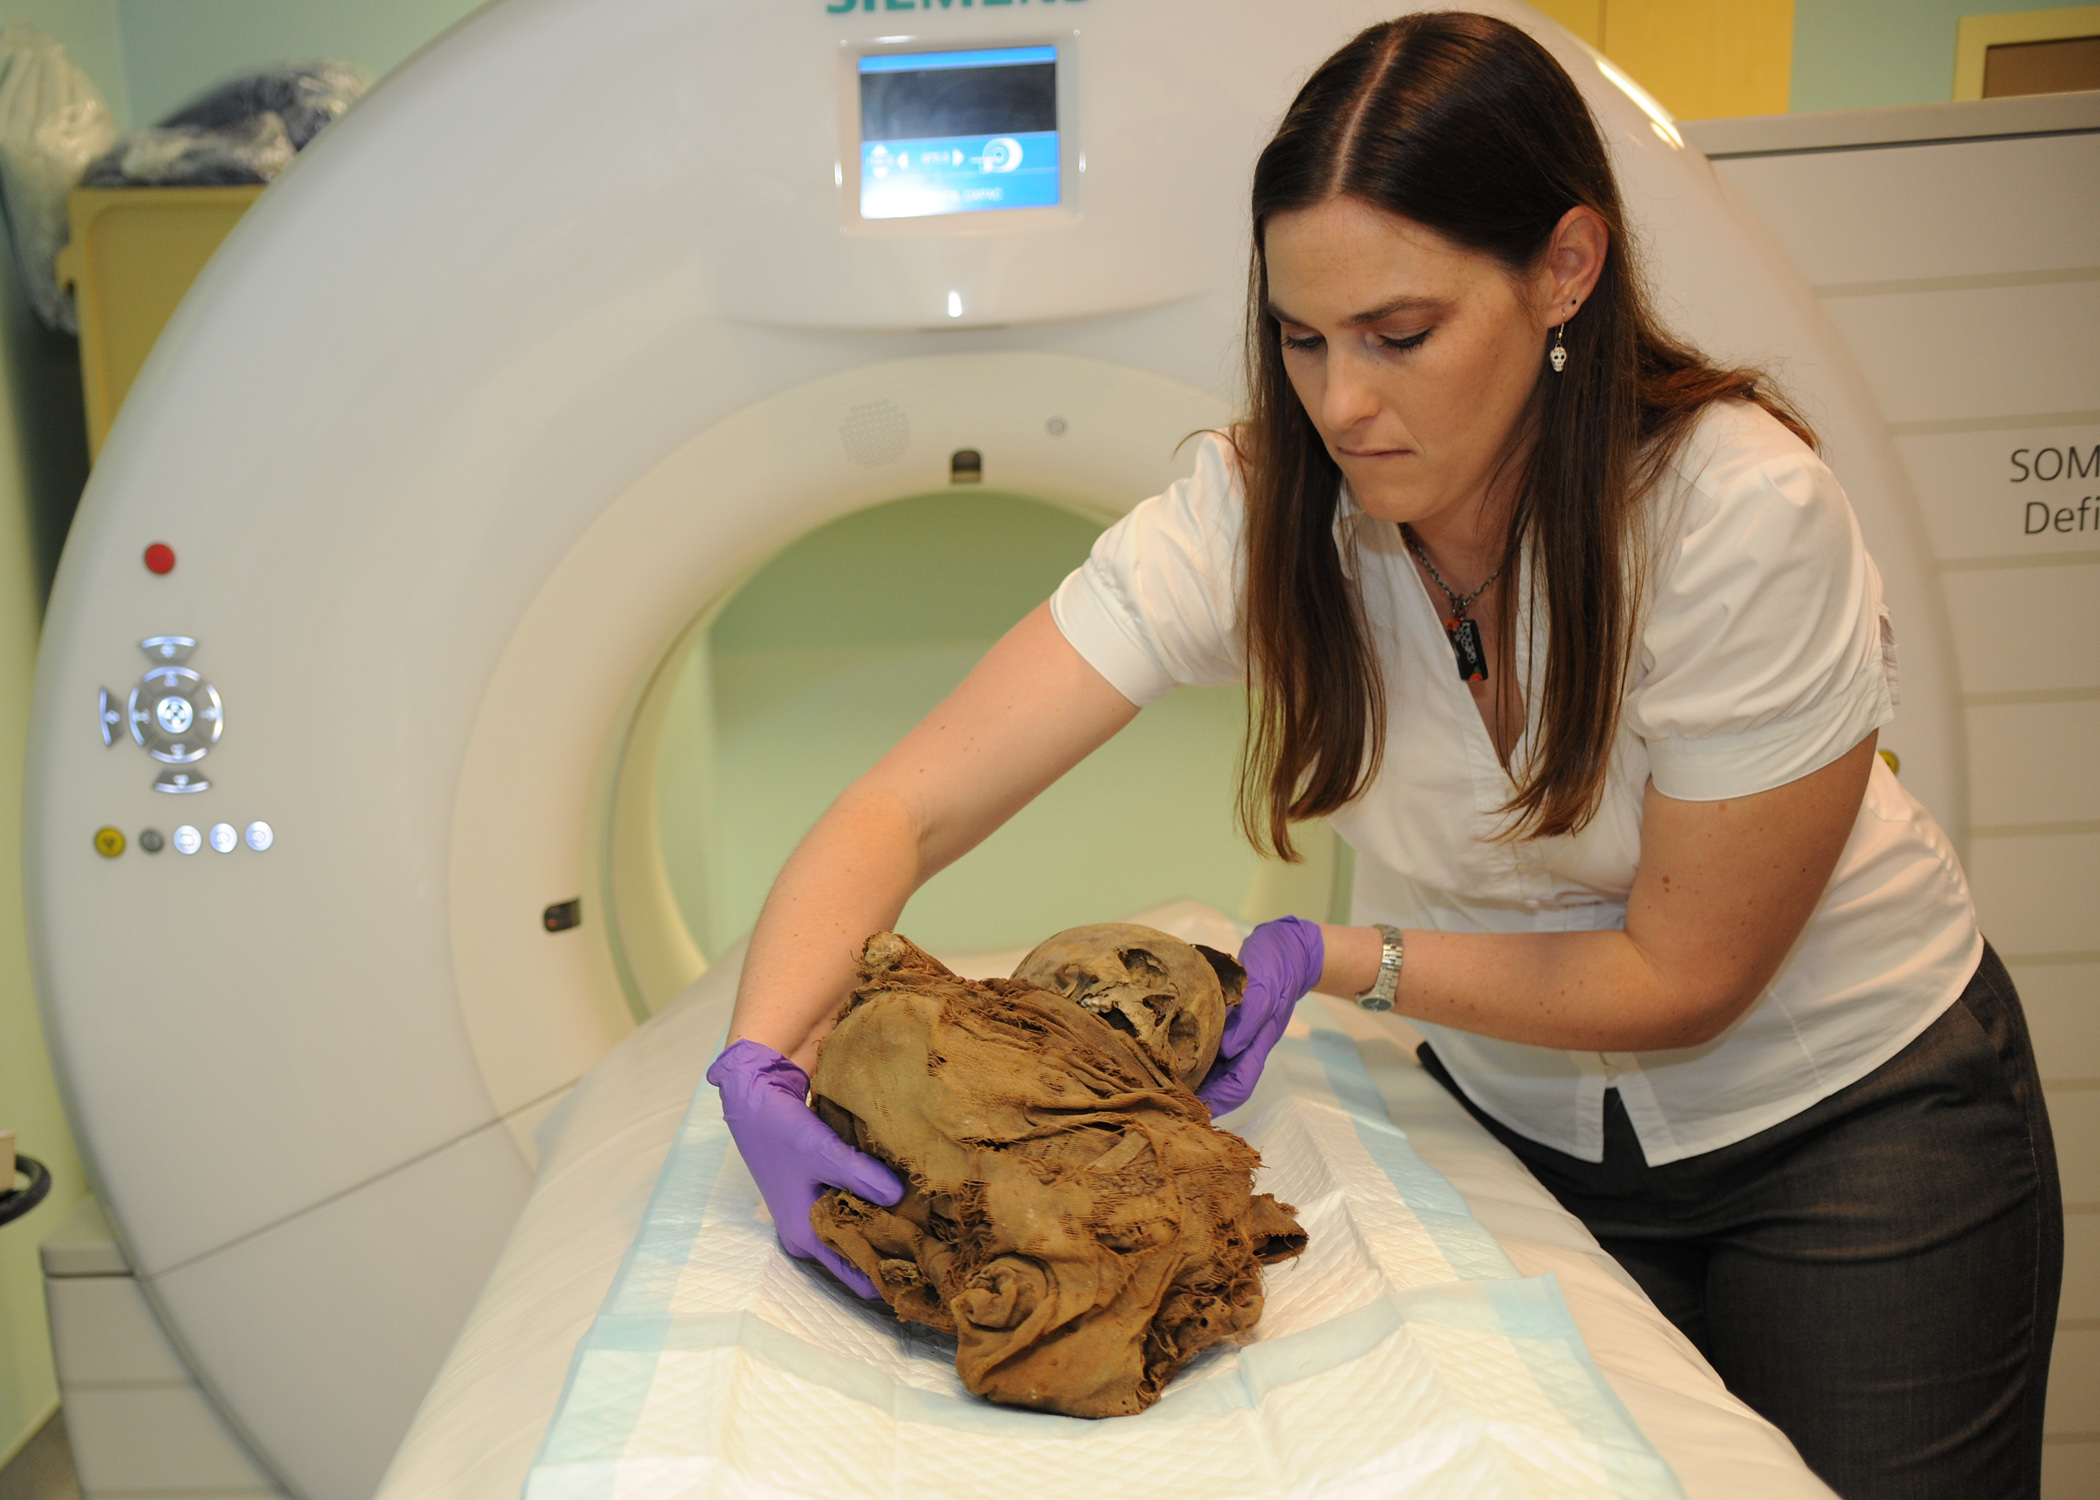
This method comes from the discipline of medicine and is a powerful non-invasive tool to capture information about the interior of an object. The way that CT works is by taking sequences of X-rays at 360 degrees around the object. The acquired ‘2D slices’ are then computed to generate volumetric data.
CT is less accessible for heritage digitisation, due to the high cost of such equipment, and hence it often requires transferring artefacts to medical facilities. In the heritage domain, computed tomography has been used widely to document and study mummies (mostly Egyptian) without having to unwrap them.
Yet, the deployment of the technology to document mummified bodies has received criticism from several scholars as well as part of the public. Further information on this topic can be found in the case study Disturbing the Dead of the #dariahTeach website.
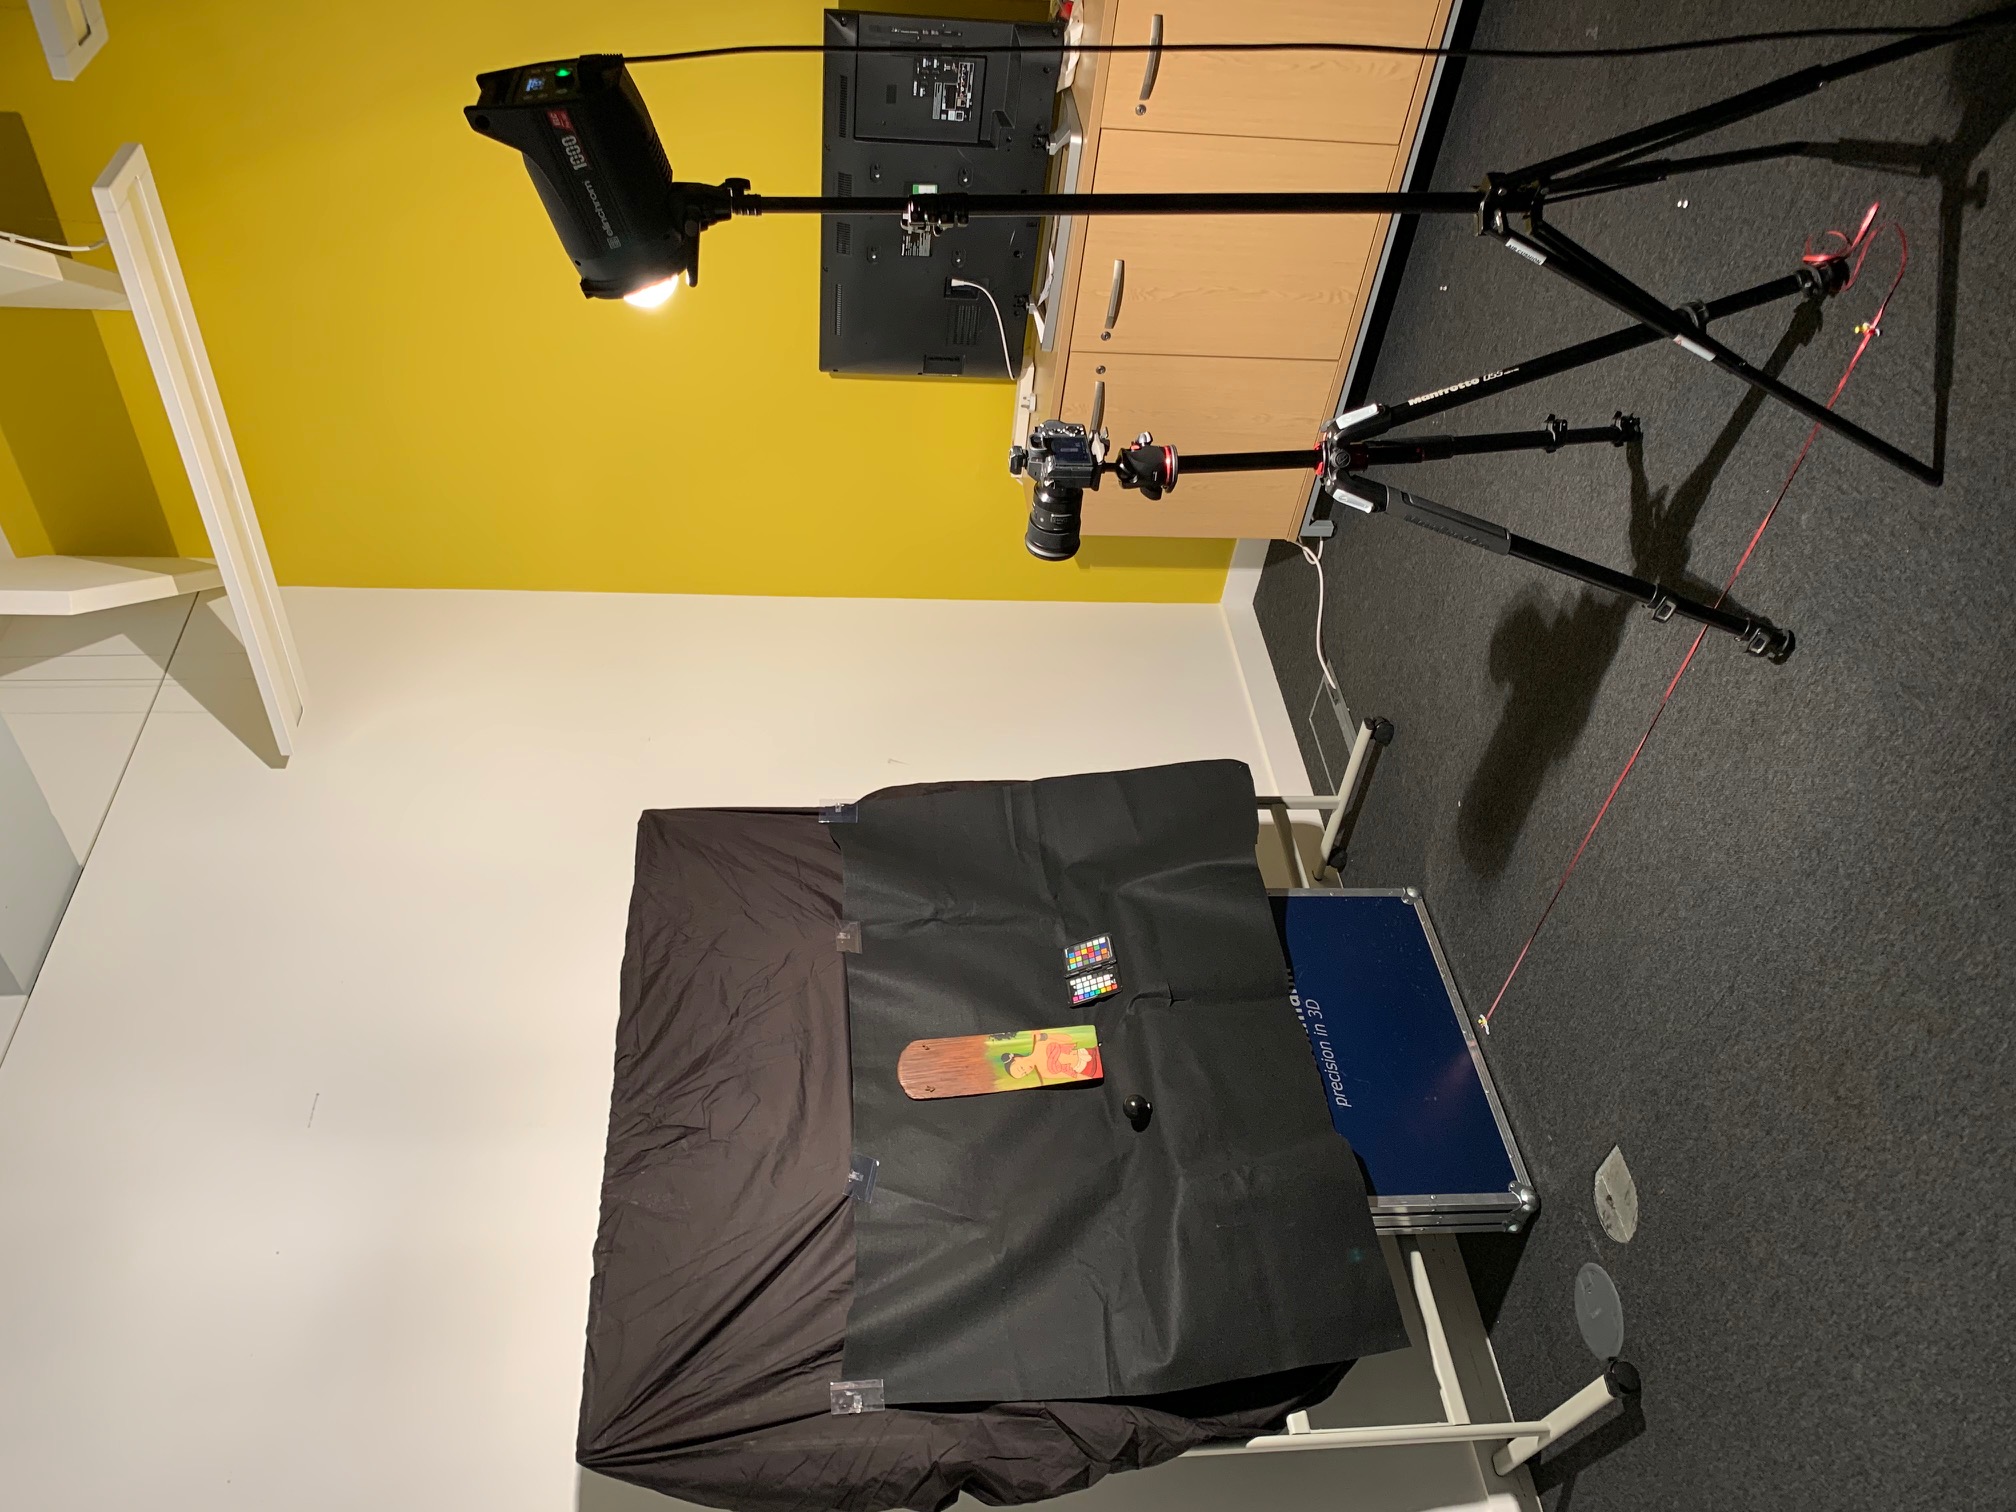
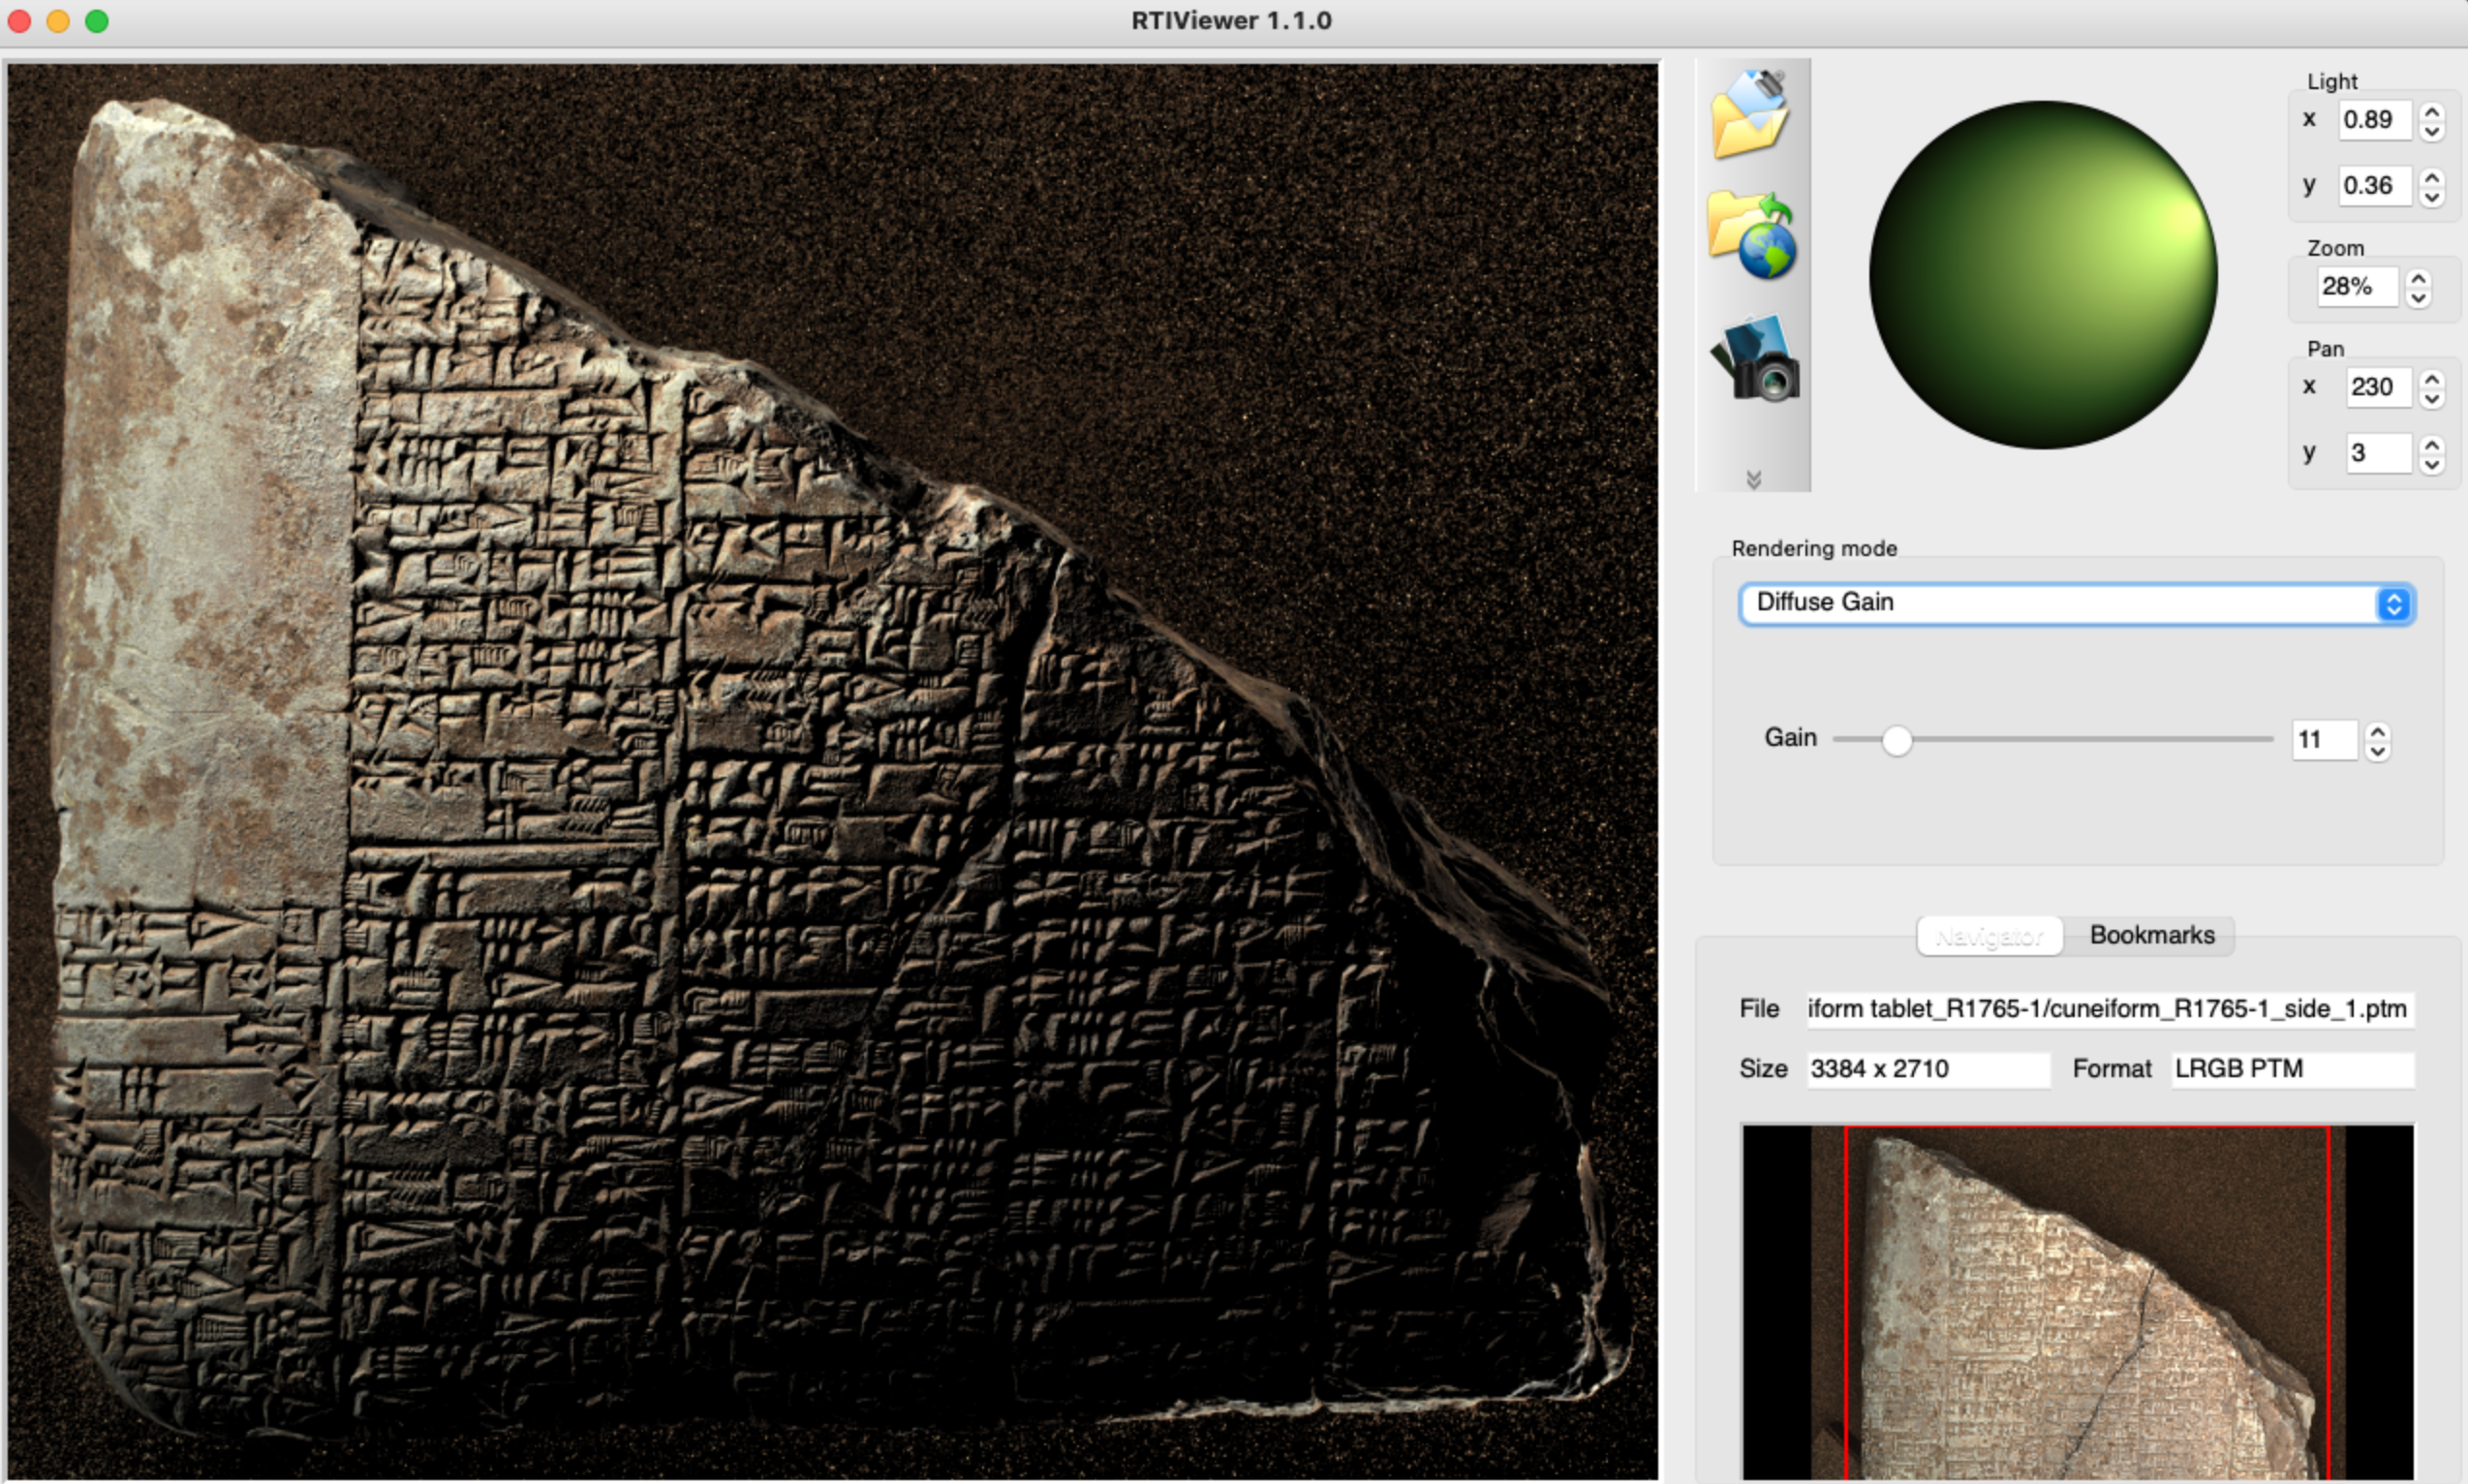
Reflectance Transformation Imaging (RTI)
Reflectance transformation Imaging refers to the method of capturing surface and colour for objects which are relatively flat but have a certain ‘implicit geometry’. These can be anything from engraved tablets and carved objects to paintings, coins and inscriptions.
RTI was developed in the HP Labs in 2001 and constitutes a method which mathematically enhances the surface shape and colour of an object by calculating and visualising the direction of the light which was used when acquiring images with a camera. RTI is not a 3D digitisation method, and it could be better described as a qualitative 2.5D digitisation technique to document material culture.
The most popular RTI method is Highlight RTI which can be done by using a camera on a tripod, a source of light and other easily found equipment (ball, measuring tape, backdrop fabric etc). Another method is the Dome RTI. This needs a dome with attached lights on it and a camera placed on top to acquire a series of images while dedicated software controls the lights on the dome. In both cases, the acquired data are processed with dedicated software to produce a relightable image of the object from any direction, enabling improved viewing, studying and enjoyment.